Challenge Overview
Welcome to the 3D Seismic Volume Analysis ideation challenge. Our client has interests in geophysics research, and it approached Topcoder with a problem related to automated analysis and interpretation of 3D Seismic data, explained below. In this competition we want Topcoder members to educate themselves on the basics of seismic data representation and processing, and then, combining this knowledge with their experience in computational, data analysis, and/or machine learning methods, to propose efficient, innovative, and promising methods of feature extractions from seismic data. The submission to this challenge will consist of the written report describing competitor ideas, supported by any relevant analysis, and optionally proof-of-concept code. It will be judged subjectively by the client and Topcoder. Depending on the outcomes of this challenge, we will likely to follow with data-science, and development competitions to implement the best ideas into functional prototypes, and benchmark them on real data.
Today there are various methods to process the input seismic volume & generate an output that highlights the faults making them easier to visualize. One such process generates a 3D Fault Likelihood volume. In a nutshell it is a 3D grid, with two coordinates corresponding to the geographical coordinates on the Earth surface, and the third coordinate corresponding to the depth inside the ground. The value associated with each grid node specifies the estimated likelihood (probability) that the node lies on a geological fault, or it is located close to it. The problem our client looks to solve is to develop an algorithm able to, given a 3D Fault Likelihood volume, automatically extract fault planes contained within that volume. See the following images to better understand the problem.
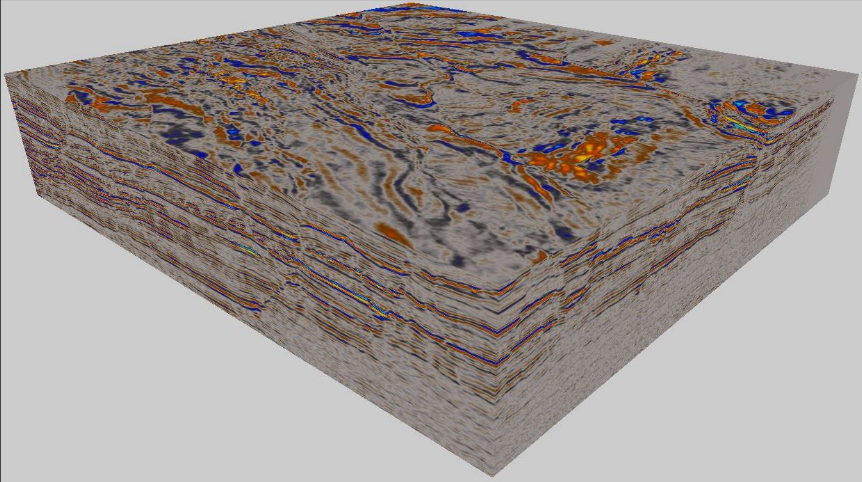
Figure 1. The raw 3D seismic amplitude volume displays how well seismic waves are reflected inside different points of an Earth’s surface and images its structure.
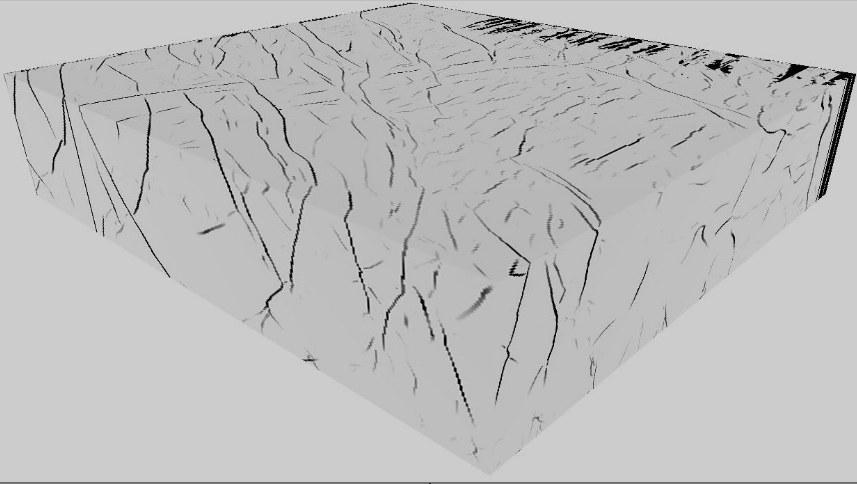
Figure 2. A 3D Fault Likelihood volume calculated from the raw 3D seismic data displays at each point the likelihood that the point lies at a fault. Bright colors (most of the volume) represent low probability, and the dark colors represent high probability of a fault. Seen together these points image fault planes found in the original data. Fault likelihood volumes are the input to the problem we want solved.
As you see from the illustration, most of the dark points are arranged into planes cutting through the surface slab, and possibly intersecting each other. The goal of this project is to come up with an algorithm that automatically recognizes fault planes.
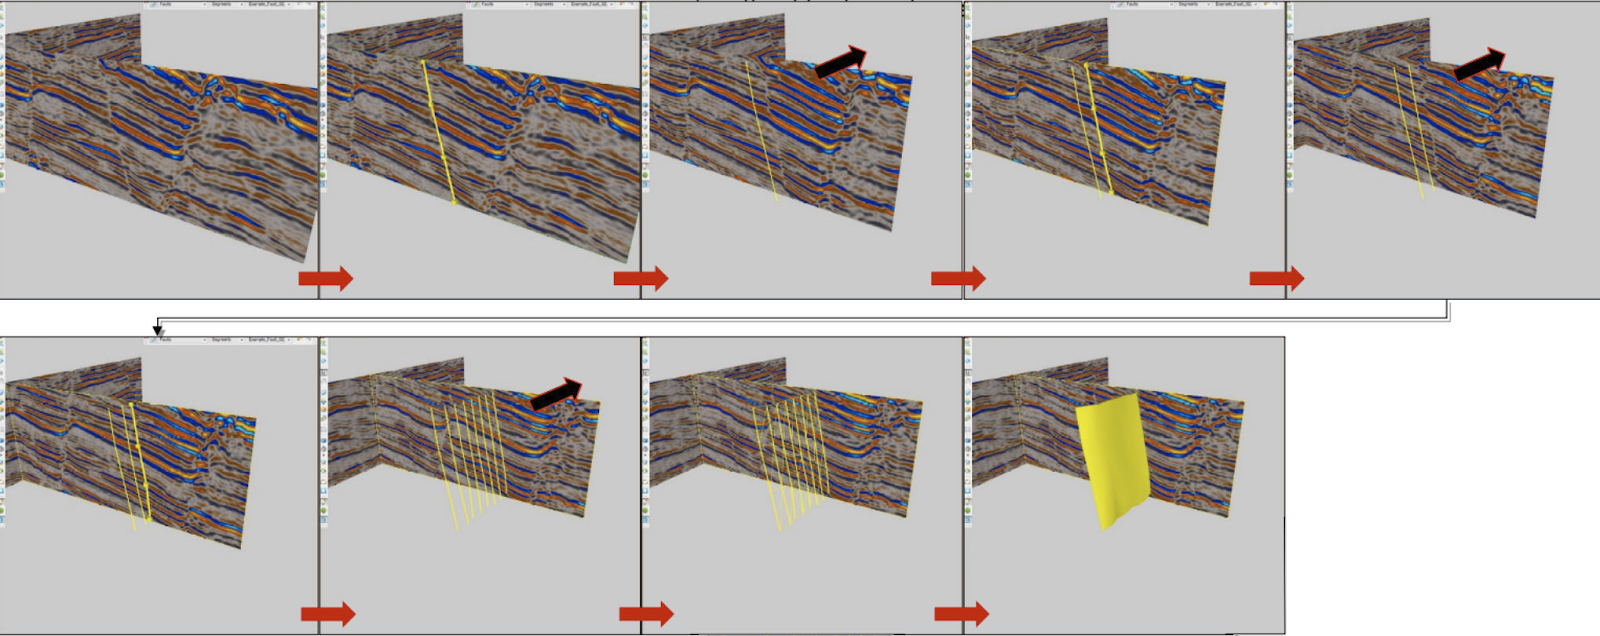
Figure 3. Manual extraction of fault planes. An expert examines visually cross-sections of 3D Seismic (at this illustration) or Fault Likelihood volume, and marks by “fault sticks” the lines where a fault crosses the cross-section. The fault plane is then triangulated based on the positions of corresponding sticks in a series of cross sections.
In the challenge forum you will find an example 3D Fault Likelihood volume in SEG-Y format. The original seismic volume is also provided in the forum. We believe that the generation of 3D Fault Likelihood volume is accurate, and the fault locations can be reliably extracted out of it, thus the goal of this project is to use 3D Fault Likelihood volume as the only input and extract fault locations from it. However, in case you believe additional data contained in the original seismic volume may be helpful for understanding the problem, or may be used to improve the fault extraction, we provide it for your reference, and we are open for approaches that use it as an additional or alternative input, if it is demonstrated to be beneficial.
You should be able to find a bunch of existing libraries and tools for manipulation and visualisation of SEG-Y data, including but not limited to:
Consider to include the following sections in your written report:
Description of The Problem
Reflection seismology allows us to image the inner structure of Earth’s surface layer by sending down test seismic waves, and recording their “echo”, i.e. their reflection from heterogeneities inside the ground. One important type of heterogeneity is called a fault, which is defined as a planar fracture or discontinuity in a volume of rock across which there has been significant displacement as a result of rock-mass movement. The location of planar faults is an important topic in geophysics and geology because faults with high stress within them are the cause of most earthquakes. The successful interpretation (extraction) of these faults is a critical step in subsurface exploration. Typically the faults planes are extracted via a manual process where a human interpreter “draws” fault sticks on a series of slices visualized in the volume. These sticks are then images together as a triangulated plane (see later images). This is an extremely time-consuming & manually intensive process.Today there are various methods to process the input seismic volume & generate an output that highlights the faults making them easier to visualize. One such process generates a 3D Fault Likelihood volume. In a nutshell it is a 3D grid, with two coordinates corresponding to the geographical coordinates on the Earth surface, and the third coordinate corresponding to the depth inside the ground. The value associated with each grid node specifies the estimated likelihood (probability) that the node lies on a geological fault, or it is located close to it. The problem our client looks to solve is to develop an algorithm able to, given a 3D Fault Likelihood volume, automatically extract fault planes contained within that volume. See the following images to better understand the problem.
Figure 1. The raw 3D seismic amplitude volume displays how well seismic waves are reflected inside different points of an Earth’s surface and images its structure.
Figure 2. A 3D Fault Likelihood volume calculated from the raw 3D seismic data displays at each point the likelihood that the point lies at a fault. Bright colors (most of the volume) represent low probability, and the dark colors represent high probability of a fault. Seen together these points image fault planes found in the original data. Fault likelihood volumes are the input to the problem we want solved.
As you see from the illustration, most of the dark points are arranged into planes cutting through the surface slab, and possibly intersecting each other. The goal of this project is to come up with an algorithm that automatically recognizes fault planes.
Figure 3. Manual extraction of fault planes. An expert examines visually cross-sections of 3D Seismic (at this illustration) or Fault Likelihood volume, and marks by “fault sticks” the lines where a fault crosses the cross-section. The fault plane is then triangulated based on the positions of corresponding sticks in a series of cross sections.
In the challenge forum you will find an example 3D Fault Likelihood volume in SEG-Y format. The original seismic volume is also provided in the forum. We believe that the generation of 3D Fault Likelihood volume is accurate, and the fault locations can be reliably extracted out of it, thus the goal of this project is to use 3D Fault Likelihood volume as the only input and extract fault locations from it. However, in case you believe additional data contained in the original seismic volume may be helpful for understanding the problem, or may be used to improve the fault extraction, we provide it for your reference, and we are open for approaches that use it as an additional or alternative input, if it is demonstrated to be beneficial.
You should be able to find a bunch of existing libraries and tools for manipulation and visualisation of SEG-Y data, including but not limited to:
- https://github.com/equinor/segyio - C library for SEG-Y manipulation, with language bindings for Python and Matlab.
- https://cultpenguin.gitbooks.io/segymat/content/ - Matlab and Octave library for SEG-Y manipulation.
- https://www.dgbes.com/index.php/download - Free software for interpretation of seismic data.
- https://github.com/dhale/ipf contains sample programs for manipulation and processing of seismic data
- Also two articles covering existing approaches to the problem are shared in the challenge forum.
- A separate output file for each detected fault plane
- Payload in the file should be in text format, and describe the fault plane as a mesh. We are likely to specify the preferred data format during the challenge.
Final Submission Guidelines
Submission Format
Your submission to this challenge should consist of a written report, in text, docx, ppt, or pdf format, with your best idea how to solve the problem, with any supporting theory, and data analysis which proves the feasibility and efficiency of your idea. You are encouraged to include a proof-of-concept code with demonstrates your idea in action.Consider to include the following sections in your written report:
- Overview: describe your approach in “laymen’s terms”
- Methods: describe what you did to come up with this approach, eg literature search, experimental testing, etc
- Tools: did your approach use a specific technology? Any libraries? List all tools and libraries you used
- Discussion: Explain what you attempted, considered or reviewed that worked, and especially those that didn’t work or that you rejected. For any that didn’t work, or were rejected, briefly include your explanation for the reasons (e.g. such-and-such needs more data than we have). If you are pointing to somebody else’s work (eg you’re citing a well known implementation or literature), describe in detail how that work relates to this work, and what would have to be modified
- Data: What other data should one consider? Is it in the public domain? Is it derived? Is it necessary in order to achieve the aims? Also, what about the data described/provided - is it enough?
- Assumptions and Risks: what are the main risks of this approach, and what are the assumptions you/the model is/are making? What are the pitfalls of the data set and approach?
- Results: Did you implement your approach? How’d it perform? If you’re not providing an implementation, use this section to explain the EXPECTED results.
- Other: Discuss any other issues or attributes that don’t fit neatly above that you’d also like to include
Checkpoint Submission
In this challenge, we allow checkpoint submissions. In the checkpoint submission, please at least include a report draft containing “Abstract / Description” part. The deadline for checkpoint submission is 23:59 ET, Feb 16, 2020. The feedback on the checkpoint submission will be provided within the next few days, and five $100 prizes will be awarded to the best checkpoint submissions. To receive a checkpoint prize you must submit a complete final submission to the challenge by its end.Judging Criteria
Challenge submissions (both the checkpoint, and the final one) will be judged subjectively by the client and Topcoder, based on the quality of your ideas, their description and presentation, and the relevance to the client problem. In particular, will take into account:- Is the approach presented in a clear and concise way.
- Is it well explained, why the approach will solve the problem with reasonable accuracy. A proof-of-concept code demonstrating the method in action on the provided sample data, although not obligatory in this competition, may be especially helpful here.
- Is it feasible to implement proposed method with a reasonable efforts.