Challenge Overview
Introduction
In this challenge, we are looking for an algorithm to choose the best subset of routes from the bus network within the Tokyo metropolitan area, under a given budget.
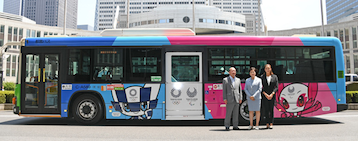
Some of the buses are called “wrapping bus”, i.e., they can be wrapped with advertisements (like the photo). The sponsor company buys the advertisement slots of these wrapping buses and wants to maximize the total number of reached people or the target age groups within the budget. The cost of advertisement slots differs per route.
The goal of this challenge is to design an algorithm that takes input from 2 sources of data (1) bus route data, and (2) population data per age group per time interval, then returns the optimal or nearly optimal subsets of bus routes that can reach to most number of people within the given budget and the target age groups.
The running time of your algorithm/implementation is also a significant factor in the scoring.
This challenge is similar to a classical fun (algorithm) marathon match, but with prizes!Hope you have fun, and Good Luck to all!
Background

Each colored line represents a bus route. The grid colors reflect the number of population within the geolocational grids or certain time and age groups of users (like a heat map). Each bus route has a limited number of wrapping buses and the cost of those wrapping buses varies per route.
The advertisement sponsor would like to buy some of these wrapping buses within their budget, and certainly want to reach to maximum number of target age group people looking at those advertisements.
Data Description and Scoring
There are 3 datasets
-
Route.geojson
- RouteID: The ID of this route. It is unique across different routes.
- Cost: advertisement cost per bus of this route
- TZ1: the maximum number of wrapping buses of this route in the TZ1 time interval. There will be no wrapping bus running at this time slot. This is always 0.
- TZ2: the maximum number of wrapping buses of this route in the TZ2 time interval.
- TZ3: the maximum number of wrapping buses of this route in the TZ3 time interval.
- TZ4: the maximum number of wrapping buses of this route in the TZ4 time interval.
- Geometry: Route geometry data. It is a polyline.
-
Population.geojson
- MeshID: The ID for a specific grid. It’s unique across different grids.
- G1_TZ1: The number of people from the age group G1 in the time interval TZ1 and this grid.
- G1_TZ2: The number of people from the age group G1 in the time interval TZ2 and this grid.
- … (all pairs between G1..G6 and TZ1..TZ4
- G6_TZ4: The number of people from the age group G6 in the time interval TZ4 and this grid.
- Geometry: Grid geometry data. It is a polygon.
-
Active.csv
- TZ1: The estimated ratio of people outside the building in the time interval TZ1. We will need to multiply this ratio to the number from Population.geojson to determine the people outside the buildings in specific grid.
- TZ2: The estimated ratio of people outside the building in the time interval TZ2.
- TZ3: The estimated ratio of people outside the building in the time interval TZ3.
- TZ4: The estimated ratio of people outside the building in the time interval TZ4.
For above datasets;
- Time slots are divided as following. In our dataset, the populations in TZ1 are all zero. So you can ignore this time slot.

- Age groups (generations) are divided as following

Rules
- We can assume all buses start and finish within one hour, which fully lies in the same time interval. That is, every bus will move from the first stop to the last stop within an hour, and this hour is fully within a certain time interval. This will simplify the calculation without corner cases right on the boundary. For example, there will be NO bus starting from 9:30AM and ending at 10:30AM.
- Each route has a specific number of wrapping buses that can run per time slots. For instance, TZ1=0, TZ2=4, TZ3=3, TZ4=1. If you buy 2 buses for this route, wrapping bus can only run at this maximum number: TZ1=0, TZ2=2, TZ3=2, TZ4=1
- The number of wrapping buses is per hour. For example, in the TZ2 time, there are 2 hours in total. So if TZ2=3, there will be 6 buses running. The reaching population will be then multiplied by 6.
- The input can specify 1 or more age groups as the target audience.
- A bus will visit a grid if and only if the bus route (i.e., the polyline) has a non-zero length intersection with the grid (i.e., the polygon).
- The budget will be in a range of 5,000,000 to 30,000,000
- C/C++, Java, and Python are the allowed languages.
Reports
In order to receive a prize, you must do all the following:
- Within 7 days from the announcement of the contest winners, submit:
- A complete report at least 1 pages long, outlining your final algorithm, and explaining the logic behind and steps to its approach.
Implementation
You are asked to write your solution in either C++, Java, or Python. It contains a “main” entry point, which reads parameters from the standard input (stdin), conducts all computations, and then writes the bus route plan to the standard output (stdout).
The input parameters will follow the format below:
Line #1: Age Group (e.g., “1,2,5”). They are always split by comma. There might be some extra whitespace in between.
Line #2: Budget (e.g., 10000000). It’s a floating number.
Line #3: Population GeoJSON filename (e.g., ./data/Population.geojson). It’s a string.
Line #4: Route GeoJSON filename (e.g., ./data/Route.geojson). It’s a string.
Line #5: Active CSV filename (e.g., ./data/active.csv). It’s a string.
Your code should print the selected routes that you want to purchase on the standard output. The format will be “ROUTE_ID,CNT” per line. Here is an example:
89,190,2
Submission
Your submission should be a zip file, containing a main entry file (Main.cpp/java/py). You can write other codes and import them in the main entry file.
For example, if you are using C++, the zip file should look like this:
/
Main.cpp
We will compile your solution on our server and run it against multiple test cases. The compilation commands are as follows
C++
g++ -O2 -std=c++14 -o main Main.cpp
./main < {test_case input} > {test_case output}
Python
python3 -O Main.py < {test_case input} > {test_case output}
Java
javac Main.java
java -cp . Main < {test_case input} > {test_case output}
Scoring
The number of population that your route choice can reach is calculated automatically by the background scorer.
The score is as follows:
Score = number_of_population_reached/MAX_POPULATION * (calc_time)^-2 * 1000Note: The overall score will be calculated as an average of 2 test cases. We will be using 2 test cases to calculate provisional score (during the contest), and different test cases to calculate the final scores to win the prizes.
Where:
- For number_of_population_reached, we will only count the number of people from the target age group who were outside when the bus pass by.
- MAX_POPULATION is number of population for all routes from the target age group who were outside when the bus pass by. It assumes all the TZ_Max counts can be reached. (TZ_Max mentioned here is total of maximum number of buses for all TZ*, please see the offline tester code for details)
- calc_time is the running time of your algorithm/implementation. Time in order of 100ms. Please note that in the current scoring function, if the solution runs within 100ms, there is no penalty in the score at all. We will manually check the solution and if anyone's solution is just gaming with the scoring function, he/she will be disqualified.
- We will provide offline tester for you to test your solution locally in forums. It is identical to what is used by the system to score and run submissions. Please check the code for the details of above and please ask in the forums if you have any questions.
- If for any reason we have a tie score during the provisional phase, we will include the decimal point scores to finalize winners at the system test phase.
General Notes
-
This match is rated
-
In this match you may use any open source software. If your solution includes commercial licensed software, even just in the training stage, please ask in the forum if it can be approved. You must include the full license agreements for all software used (including any open source and approved commercial license) with your submission. Include your licenses in a folder labeled "Licenses". Within the same folder, include a text file labeled "README" that explains the usage of 3rd party software and purpose of each licensed software package as it is used in your solution.
-
The usage of external resources (pre-built algorithm models, public solvers, etc) is allowed as long as they are freely available.
-
Use the match forum to ask general questions or report problems, but please do not post comments and questions that reveal information about the problem itself or possible solution techniques.
Reference
-
Image [1]: http://www.metro.tokyo.jp/tosei/governor/governor/katsudo/2018/07/24_02.html