Challenge Overview
We are giving out bonus payments to every participant that submits and has a score +80. Thus, if you submit and you don't win but your score is +80, we will still pay you a bonus for your efforts.
Project Overview
This challenge is part of our Sunshot portfolio. Winning submissions may become and app that Investors can use to track how their endowments are used and what the corresponding impact is on the reduction of mankind carbon footprint.
Challenge Overview
We already have a html clickable prototype of the five dashboard widgets with charts/maps and we have a mongoose data models. You job is to string these two together. This project is the icing on the cake. You will need to set up mongo however we have provided the model definition with script to generate timeseries data that you can use to import it in mongo. After that everything should be pretty straight forward.
The expected from you in this challenge :
- Write nodejs script to generate test data in Mongo.
- Write ExpressJS controllers to read from mongo and serve the login page and the dashboard data.
- Update AngularJS to handle Login authentication and navigation between pages.
- Update AngularJS to communicate with ExpressJS controllers and render charts and data.
Challenge Requirements
Model Definition
-
The models are presented in this ERD diagram
-
SystemPerformance table should have additional field ‘timestamp’ that store epoch time.
-
You need to write a nodejs script that generate and store data in database for these models.
-
Generate two endowment users with enough data to test the charts and the google map.
-
-
Provided model definition in challenge forums with a script to generate system performance csv file you reuse to insert data into database.
-
Roles : The final product has two roles : Endowment and Admin. Update the User model to include “Role” field. It will have two values either “Endowment” or “Admin”
-
Here is an overview of how the entities are related :

Pages and Backend Requirements
Endowment Landing Page

-
This page is the main page in the application.
-
User should be redirected to “Login” page if not logged in.
-
Page should be accessed using “/” root path.
-
We have a UI Prototype for this page provided in challenge forums.
-
The page has 5 widgets :
-
The calculation of the widgets are provided in Excel Sheet (file attached in challenge forums), here are more clarifications :
-
Total Clean Energy Created (kWh) widget
-
“Total Energy Since 2012-2015” :
-
The date will be determined by sorting system performance entries of the endowment systems by timestamp, for first and last records in result, extract the year and construct the label.
-
If the years match then display label as “Total Energy since {Year}”
-
-
“100,000 kWh” logic :
-
Sum the systemPerformance#dailyEnergy of all systems associated with the endowment user.
-
-
Chart Logic :
-
When user clicking “View Details” a call to backend will be made to retrieve Monthly Clean Energy Created by the systems associated with the endowment user.
-
The chart will render data of a four years interval, so the backend should only send these information, it should not return all data, this will affect performance.
-
Input parameter to backend :
-
nextData (integer) : optional parameter, the value is a year.
-
previousData (integer) : optional parameter, the value is a year.
-
-
The backend will retrieve the latest 4 years data. each year is 12 months so total of 48 items will be returned.
-
If nextData is provided then backend will retrieve the 4 years data following the provided nextData value. i.e. if value is 2012 then backend will retrieve data between 2013-2016
-
if previousData is provided then backend will retrieve the 4 years data preceding the provided previousData value. i.e. if value is 2012 then backend will retrieve data between 2008-2011
-
Either nextData or previousData can be passed, rise error if both are passed.
-
Data retrieval Logic :
-
Sort systemPerformance#timestamp in ascending order
-
Filter the entries by lower/upper bound years values.
-
aggregate systemperformance#dailyEnergy values into monthly values.
-
store the value into key/value pairs, key is date (mm/dd/yyyy) and value is the monthly aggregated value.
-
-
Return response to frontend in json format.
-
-
-
Total Carbon Impact widget
-
“TOTAL C02 SAVINGS SINCE 2012-2015”
-
The date range is determined same approach as “Total Clean Energy Created (kWh) widget”
-
-
“250,879 Million Metric Tons”
-
The value of “100,000 kWh” logic of total clean energy widget (see above) multiplied by 0.45 kg/kWh.
-
-
Chart logic - same logic as “Clean Energy Created (kWh) widget” with following differences :
-
When user clicking “View Details” a call to backend will be made.
-
We only return last 4 years data.
-
Each monthly aggregated value is multiplied by 0.45 kg/kWh.
-
-
Return response to frontend in json format.
-
-
Total Amount Money Invested widget
-
“TOTAL MONEY INVESTED 2012-2015”
-
Date range follows same calculation as above widgets.
-
-
“10,879 USD”
-
Sum of the loan#loanTotal entries associated with Borrowers own the systems the endowment invested in. Basically you are doing “select sum(totalLoan) from loan, borrower, endowment where loan#borrower_id = borrower#id and endowment.id = borrower#endowment_id” (you will convert this to equivalent query in MongoDB).
-
-
Chart Logic :
-
When user clicking “View Details” a call to backend will be made.
-
Retrieve the latest 28 loan#loanTotal values from database.
-
Sort retrieved loans data by loanDate in desc. order.
-
You need to add "loadDate" (Date type) field to Loan table.
-
-
Each column in the chart represents a loanTotal value.
-
-
Return data in json format.
-
-
Total Money Earned widget
-
“TOTAL MONEY EARNED SINCE 2012-2015”
-
Date range follows same calculation as above widgets.
-
-
“100,879 USD”
-
Retrieve loans associated with the endowment.
-
For each record : loan#loanTotal values * loan#interestRate
-
Sum all records.
-
-
“Return Rate” :
-
The arrow is placeholder.
-
The return rate is calculated as follow :
-
Calculate total loans of all systems the endowment invested in.
-
For each loan calculate the earned money : loan#loanTotal values * loan#interestRate
-
Sum all earned money
-
Divide earned money / total loans = Return Rate % value.
-
-
-
Data should be send as json from backend.
-
-
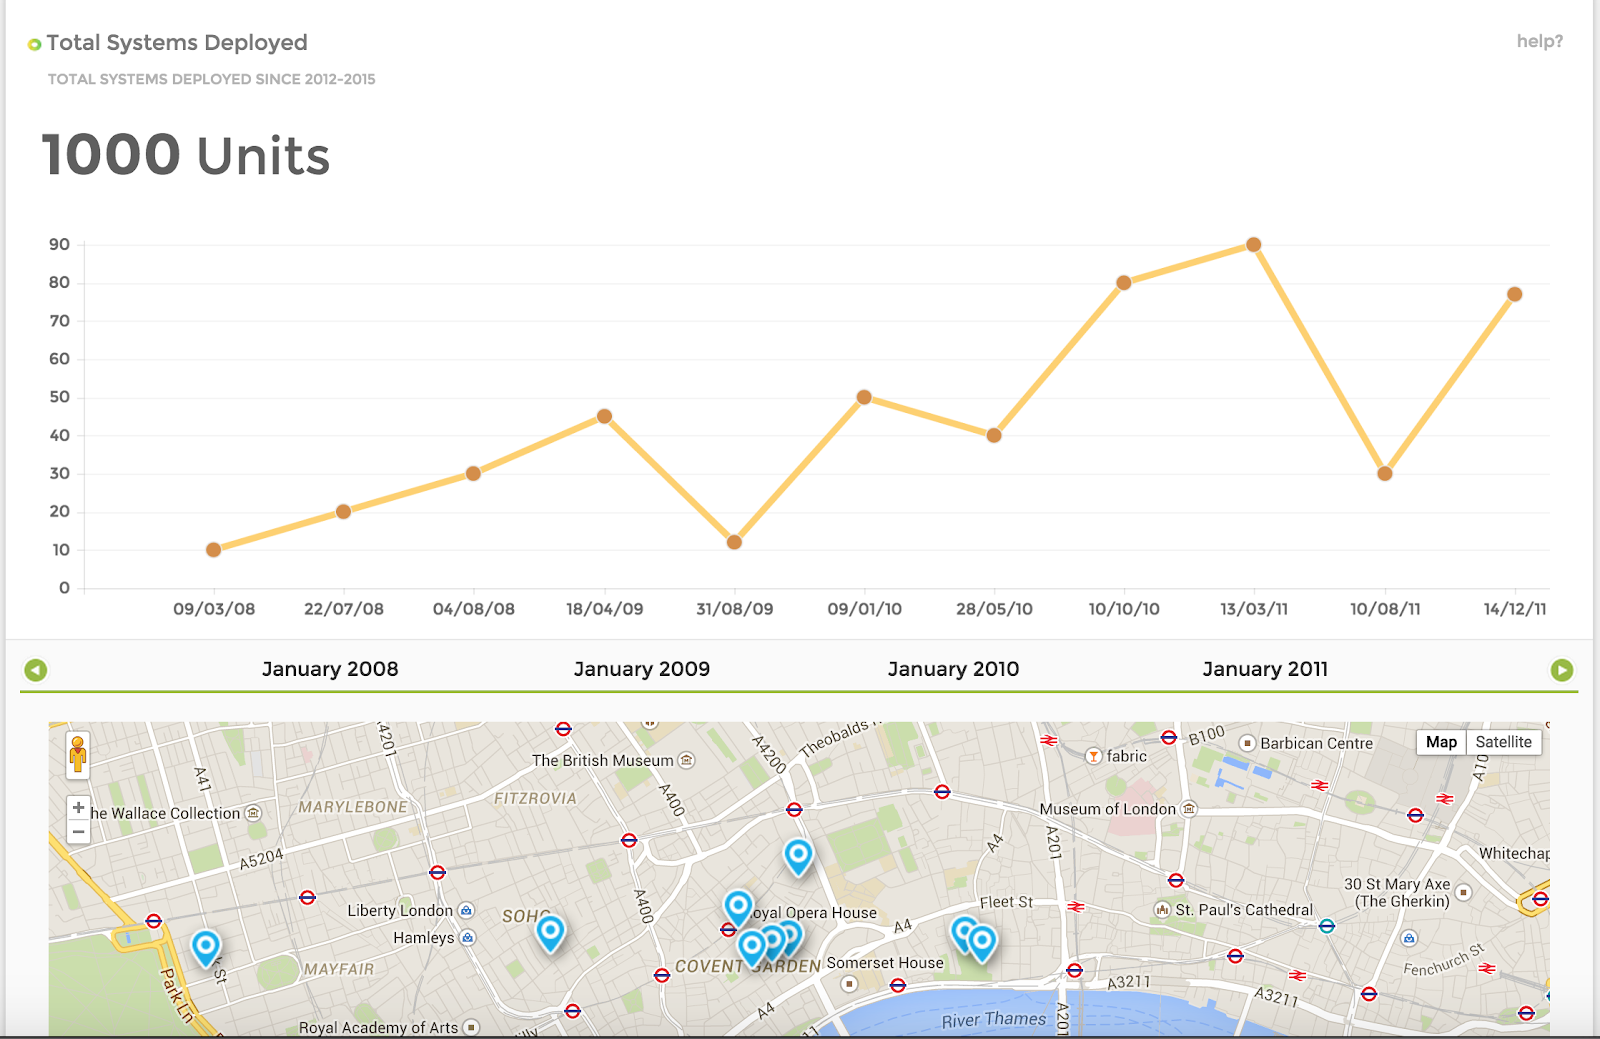
Total Systems Deployed widget
-
“TOTAL SYSTEMS DEPLOYED SINCE 2012-2015”
-
Date range follows same calculation as above widgets.
-
-
“1000 Units”
-
This is the total number of installed systems the endowment invested in.
-
-
Chart logic :
-
When user clicking “View Details” a call to backend will be made.
-
Aggregate number of installed systems by System#installationDate into monthly values.
-
Store result in key/value pairs where key is the date (mm/dd/yyyy) and value is the total number of systems in that month.
-
Pagination should be done as in “Total Clean Energy Created (kWh) widget”
-
-
Map :
-
Use google maps for the map widget.
-
Markers represent installed units.
-
Clicking on a marker should show an information popup about the unit.
-
-
-
-


Login Page
-
Reusing the UI header/footer you need to create a login page with email/password text fields centered horizontally/vertically in the page.
-
There is no forgot password or register link.
-
On successful login user will be redirected to landing page (above).
-
Use ‘http basic authentication’ : don’t use any other authentication methods.
Technology Overview
You will use the following technology stack :
-
Express.JS 4.0
-
MongoDB (latest stable version)
-
AngularJS
-
Node.JS (latest stable version)
General Note
-
Using mean.io or mean.js is prefered but you are free to use any mean stack framework or build it from scratch.
-
The pages must be responsive.
-
Provide a readme file for details about deploying the application, configuring it, and testing locally.
-
All code must be documented.
-
You need to provide sufficient test data to verify proper implementation of the charts.
Heroku Hosting
The application will be hosted in heroku. It is preferred to test your solution in Heroku and provide needed instructions to deploy there.
Folder Structure
Root directory
-
env-sample (this will be a sample of .env file)
-
app.js
-
models
-
views
-
controllers
-
public
-
app/ folder for angularjs
-
css/
-
js/
-
i/
-
-
config/ folder
-
READ.md
- anything else needed.
Documents
Provided in challenge forums :
-
UI prototype
-
Excel Sheet
- Models and CSV script.
Final Submission Guidelines
Deliverables
-
All source code that address the requirements above.
-
A readme.md file detailing all information needed to setup and run the web application locally and in heroku. With verification steps.
-
Use github flavored markup text.
-
-
text file with any notes to reviewer.
- You don't need to submit a word document for deployment guide.