

CONSUMPTION OF PUBLIC IRS INFORMATION
Please note that these projects are proof of concept exercises and in no way related to or affiliated with any of the referenced entities.
OVERVIEW
This was my first challenge on Topcoder. My solution is for the Consumption, Measurement and Analysis of Public IRS Information in PDFs on the IRS website. I chose this because Topcoder members need to fill an W-9 or W-8BEN tax form, and I was searching for information about that to understand how Topcoder works.The use case was established according to the IRS information characteristics. I needed to establish the application requirements to implement in the solution using the Adobe PDF Embed API, and determine which data could be useful to show in the Google Analytics Dashboard.
HOW I APPROACHED THE CHALLENGE
When we explore the IRS page we can access the “Forms and Instructions” section, and we can open the forms and the instructions forms as PDFs (Figure 1), but we need to open them in the browser default pdf viewer.
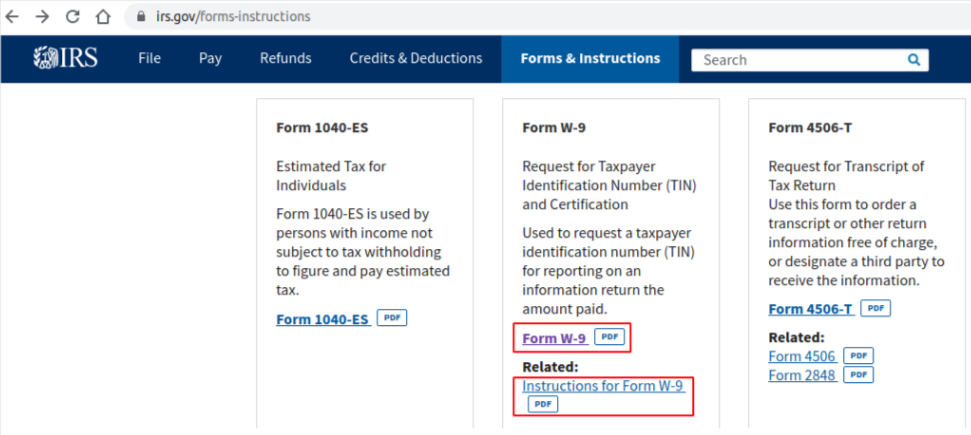
Figure 1. Forms and instructions links to PDFs.
That implementation has some issues:
The user is redirected out of the IRS page (browser default pdf viewer) or the user needs to open the PDF in a new browser tab.
We are unable to track the user’s actions in the browser default pdf viewer.
According to that, we can establish the next application requirements:
Show the form and instructions on the same page and avoid users navigating out of the IRS page.
Track the user’s actions needed for measurement and analysis.
The forms have some fields, and it might be helpful if the user can fill them out and save the information:
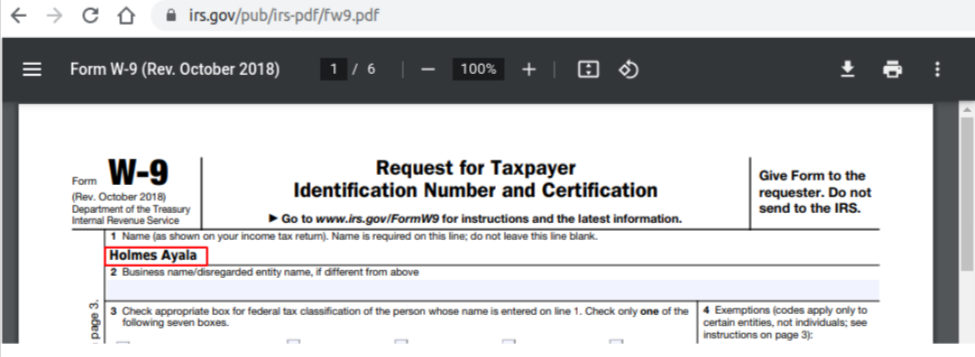
Fortunately, the Adobe PDF Embed API allows us to enable the filling and save the PDF with the information, therefore we can add the nex requirement:
Allow users to fill the forms and save the PDF with the information.
To show analysis data in the “Google Analytics Dashboard”, we need to know about the data managed by IRS: Forms and forms instructions. Therefore, it was helpful to show the forms and instructions most required by users showing the following information:
Total form views
Total views per form
Total instruction views
Total views per instructions
The instructions are composed of steps, concepts, and external resources. According to that, I considered the following information:
How much access to external resources does every instruction have?
What are the user searches in the instructions?
How many users search each instruction?
What external resources does the user access?
According to the application requirement “Allow users to fill the forms and save the PDF with the information”, it was helpful to consider:
How many users want to fill the form fields?
Finally, the extra data considered was:
Total downloads per form
How long (seconds) do users take in forms?
According to the application requirements and the measurement and analysis data, the use case redacted was:
Due to the current times of COVID-19, access to digital resources is increasing. Therefore, the IRS is interested in providing a better service to access your forms, integrating the forms and instructions on its home page.
The IRS needs to obtain data on user interaction with the forms and their corresponding instructions, such as:
Total user views of forms and instructions
User views for each form
Total downloads per form
Because users can search in the instructions and access external resources provided in the instructions, it is recommended that you provide information about user searches and access to external resources by users.
Lastly, forms have fields to fill out, you should consider allowing users to do so.
The main frontend framework was React JS, I had developed some projects with Vue JS, but I found it a bad approach for long projects, for that I needed to learn a new framework, choosing between Angular or React. I found in React the balance between complexity (Angular) and simplicity (Vue). This was my first project with React and I have been using it in all my projects.
Google Analytics uses a library to manage the communication between the application and Dashboard. It was hard for me to search for information to understand and use the library, because the resources included an old and new library.
Implementation
Show the form and instructions on the same page and avoid users navigating out of the IRS page.
A new page is loaded when the user chooses a form. The form page shows an inline PDF viewer and the button to show the instructions related with that form:
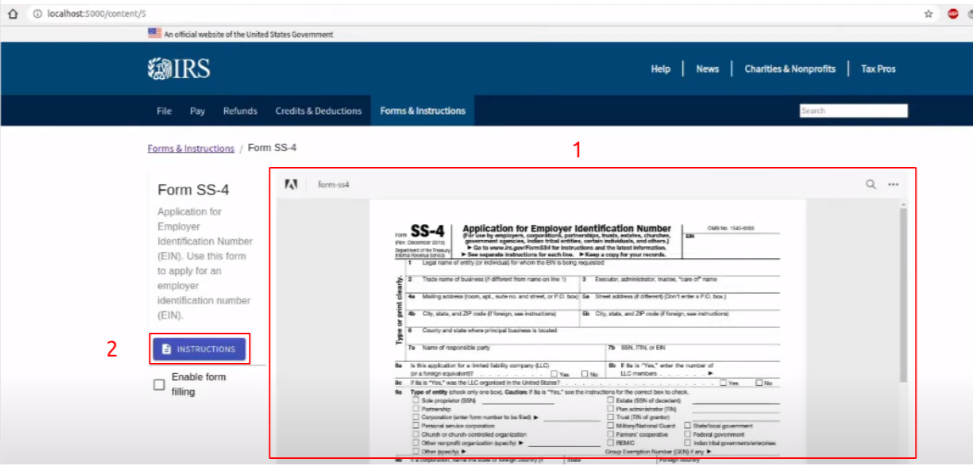
Figure 3. Inline PDF Viewer (1) and instructions button (2).
When the users click on the instructions button (Figure 3), the instructions are shown in a full screen viewer allowing the user to close it:
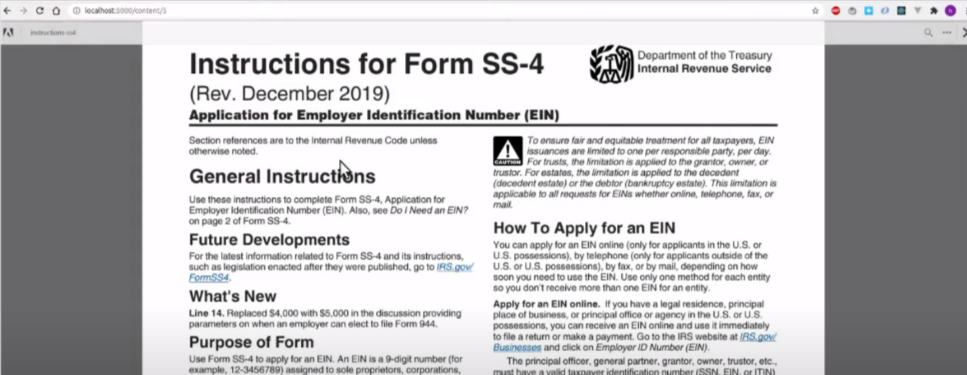
Figure 4. Instructions in a full screen viewer.
Track the user’s actions needed for measurement and aanalysis
An Google Analytic event is composed by category, action, label and value:
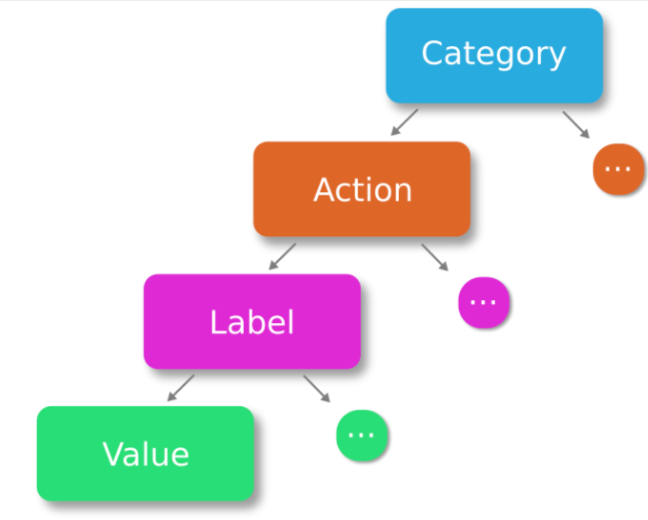
Figure 5. Structure of Google Analytics event.
I had only used the category, action and value properties as: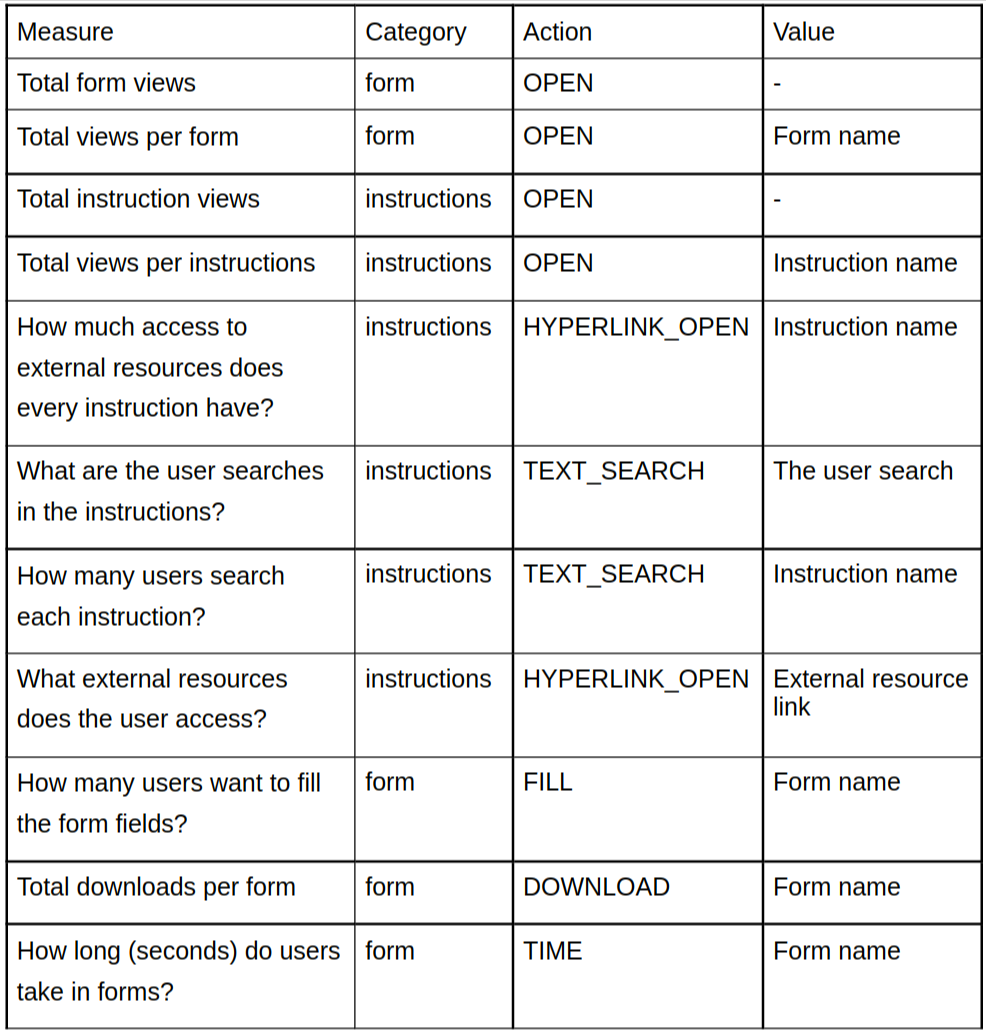
Allow users to fill the forms and save the PDF with the information
The application allows the users to fill the fields in the form by checking the “Enable form filling” checkbox, but the Adobe SDK doesn’t support some files and shows an error message. Additionally I have added a warning message under the checkbox:
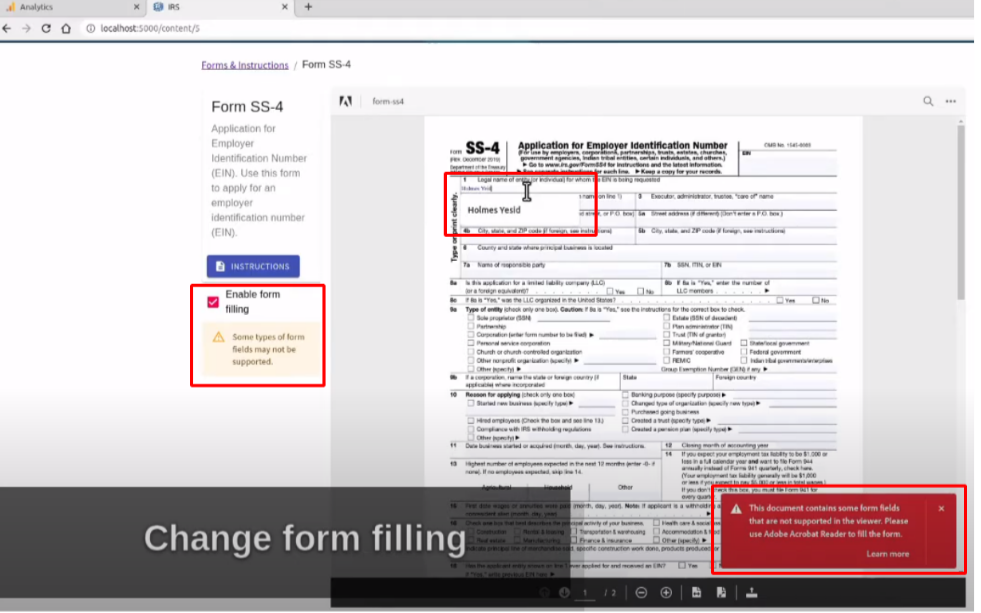
Figure 6. Form filling.
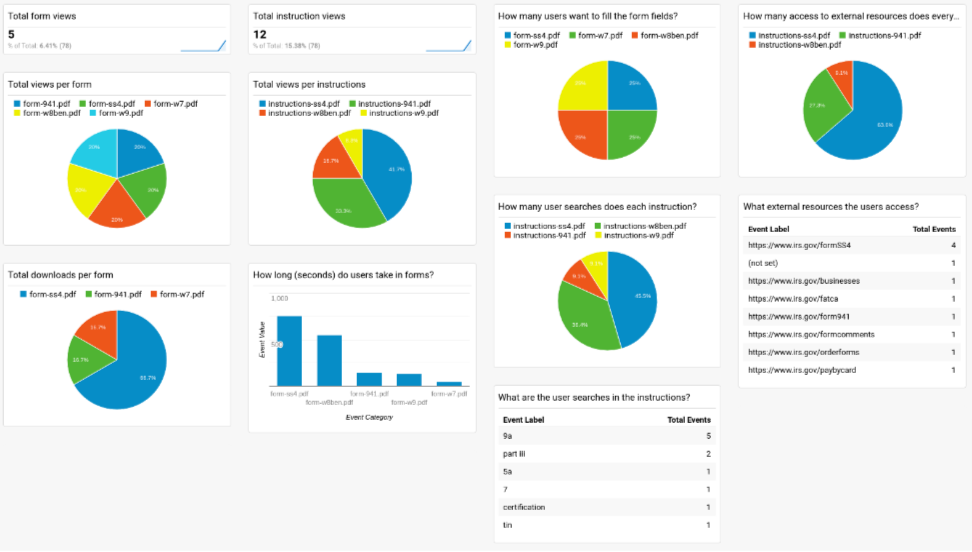
The final analytics dashboard covering all the measurement and analysis specifications looks like like this:
FINAL THOUGHTS
This challenge was helpful for me in many ways. I learned a new frontend framework, learned and integrated Google Analytics into an application, and earned money by learning. Additionally, time was an important resource to consider. I realized that I spent a lot of time on tasks with low importance reducing the time of important tasks like the Analytics Dashboard and some application requirements.
