Challenge Overview
Company Relationship Visualization is an innovative and interactive approach to data visualization. The data is being visualized in a series of relationship nodes that are changing depending on what “view” or “user scenario” you are currently in with the help of D3JS process map JavaScript library.
The goal of this challenge is to implement the designed graph elements as D3JS graph elements and demonstrates it rendering properly in a simple Forced Layout graph.
Challenge Requirements
You are addressing the following in this challenge.
Storyboard
Provided in challenge forums the storyboard design, it includes the graph elements.
UI Prototype
Use the provided UI prototype in challenge forums to implement the requirements.
JS Libraries
-
- You’re mainly going to code JS using D3JS library to render graph elements in this challenge.
-
- You are free to use any open source library that helps you address the requirement.
Graph Data Structure
Provided in challenge forums Excel Sheet with sample data :
-
- Nodes sheet represents the graph nodes, it contains company attributes.
-
- Parent-Child sheet is the ownership edges, first column represents the child, second column is the parent (parent owns child)
-
- Finance Event sheet used to render finance events when running timeline.
-
- R&D collaboration sheet represents the collaboration edges between companies.
Since you are building a simple graph you need to suggest a proper JSON structure for the data to be used by the graph. This JSON structure will be used in follow up challenges to extend the functionality of the graph.
Nodes
We have three stylings for a node :
-
- Filled Circle
-
- The node will have a filled circle body and darker stroke border color as in screenshot above.
-
- The node will have a text label associated with it represents the company name (from nodes shee)
-
- On clicking on the node circle prompt an alert window with name of the node.
-
-
- Filled Circle with a smaller circle on top of it
-
- The node is same as above one but we have another small circle with digit inside it that is clickable.
-
- On clicking on the node circle prompt an alert window with name of the node.
-
- On clicking on the small circle on the node prompt an alert window with the number displayed on the circle.
-
-
- Filled Circle with multi-colors stroke
-
- The node is same as above except that the circle will have a stroke with multi-colors different than the circle color.
-
- Demonstrate this one with a stroke with 1 color, 2 colors, or 3 colors.
-
-


Links
We have two type of links in the graph:
-
- Dotted path/link
-
- This one has no direction.
-
-
- Solid path/link
-
- This one has a direction from parent to child node (see parent-child sheet), but we don’t show an arrow for direction.
-

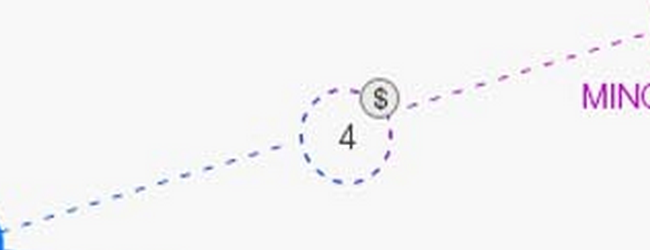
In both link types, we display circle markers in the middle of the path:
-
- Dotted circle
-
- This one represents the collaboration strength in the sheet.
-
- The circle will display a number.
-
- It sometimes has a small dollar sign circle on top of it.
-
-
- Solid circle with a stroke
-
- This one represents ownership.
-
- The percentage value is attribute.
-
- The stroke is always a single color, and it is filled based on the percentage of the circle, i.e. in screenshot 80% of the stroke is filled with color as displayed inside the cirlce.
-
-
- We need to show both circles displayed in dotted path or solid path at the same time, so you need to cover all cases where the dotted/solid circle can be displayed on any path, or they can be displayed both on the same path.
-
- Clicking on any circle or the dollar sign circle should prompt an alert window.
Sample Graph
-
- You will update the UI prototype to demonstrate these elements are rendering properly with proper JSON structure, we need the smaller graph version you can produce, no complication please.
-
- Implement zooming in/out of the circle to demonstrate that styling don’t break on zooming in/out.
Browser Compatibility
-
- IE10+
-
- Latest Google Chrome (Windows & Mac OS)
-
- Latest Safari (Windows & Mac OS)
-
- Latest Firefox (Windows & Mac OS)
HTML5
-
- Provide comments on the page elements to give clear explanation of the code usage. The goal is to help future developers understand the code.
-
- Please use clean INDENTATION for all HTML code so future developers can follow the code.
-
- All HTML code naming should not have any conflicts or errors.
-
- Element and Attribute names should be in lowercase and use a "-" to separate multiple-word classes (i.e.. "main-content")
-
- Use semantically correct tags- use H tags for headers, etc. Use strong and em tags instead of bold and italic tags.
-
- No inline CSS styles- all styles must be placed in an external stylesheet.
-
- Validate your code- reviewers may accept minor validation errors, but please comment your reason for any validation errors. Use the validators listed in the scorecard.
CSS3
-
- Provide comments on the CSS code. We need CSS comments to give a clear explanation of the code usage. The goal is to help future developers understand the code.
-
- Please use clean INDENTATION for all CSS so developers can follow the code.
-
- All CSS naming should not have any conflicts.
-
- As possible use CSS3 style when create all styling.
-
- Use CSS to space out objects, not clear/transparent images (GIFs or PNGs) and use proper structural CSS to lay out your page.
-
- Use variables with well-chosen names. Use some sort of naming convention.
-
- Use relative path names for content (images): “url(Images/image.png)”. So put images in a subfolder from where the css resides.
-
- Flex box layouting preferred.
Javascript
-
- You must use D3JS library. And you can use any open source D3JS library.
-
- All JavaScript must not have a copyright by a third party. You are encouraged to use your own scripts, or scripts that are free, publicly available and do not have copyright statements or author recognition requirements anywhere in the code.
-
- Angular should not be used for this project.
-
- Use camelCase for variable naming. PascalCase for “class”-, “interface”- and “module” names. Prepend an I (uppercase i) for interface declaration.
Images
-
- Images should be properly compressed while still having good visual quality.
-
- Please use best practice repetition usage of background based image.
-
- Please use sprites when using icons for your submission.
References
-
- Examples
Submission Guidelines
-
- A complete list of deliverables can be viewed in the UI Prototype Competitions Tutorial.
-
- Submit the updated UI prototype.
-
- Include list of files modified.
Final Submission Guidelines
.