Challenge Overview
Welcome to Hitachi - Time-Series Data Labeling Architecture and Algorithm Ideation Challenge. The client, Hitachi Ltd is a well-known Japanese multinational conglomerate company, one of the leading companies in electronics manufacturer and ICT.
In today’s world, Machine Learning (ML)/AI is becoming an important technology as never before. But one of the biggest bottlenecks in the development of ML is the necessity to provide a large set of training datasets that in most cases needs labeling by hand.
To overcome this issue, there are multiple new technologies to programmatically build and manage training datasets such as Snorkel and Fonduer originally developed by HazyResearch at Stanford. Although these are mostly focused on text data.
In this challenge, the client is looking for an innovative idea (new architecture and algorithms) with sample code to programmatically label time-series data.
We will be looking for 2 items in this challenge.
- Report to explain your new idea (architecture and algorithm)
- Sample program implementing your idea to extract features from training data and label time-series CSV data that we provide.
Please see details of each item below the Goals and Submissions section.
Good Luck!
BONUS: We will be having Checkpoint to award 5 for $100 each. Please see the “Checkpoint” section below for the details. The client has the sole right to offer additional prizes if there’s great potential in your idea even if you did not make it in top 5.
Background on Time-Series Data Labeling
AI analysis of time-series data obtained from various sensors then leverage those analysis to lead to business value such as productivity improvement and cost reduction are nowadays getting important as never before. For example, by analyzing time-series data obtained from a vibration sensor or a temperature sensor attached to a manufacturing equipment, then detecting equipment failure or a sign of failure, can be used to reduce product loss due to spoiled work and/or losing a business opportunity.
However, in analyzing those time-series data with AI, obtaining a large set of training data can become a major obstacle. Specifically, the time-series data is just data having time and value sets, and a section in which an abnormality has occurred or a section in which a sign of abnormality has been captured are not usually specified. Therefore, it is necessary for humans to identify abnormal sections or sections that indicate signs from the time-series data, and manually label such as “Abnormality occurrence” or “Abnormal signs”, which takes an enormous amount of time.
Below is an image diagram of the labeling process.
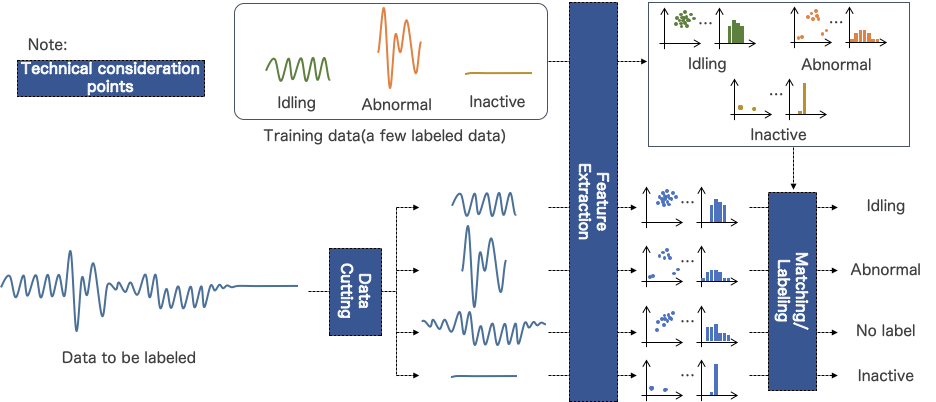
Please note that the above data is just an example for understanding purpose. The actual CSV file has multiple sensor data within the times and you will need to cut, extract, and label based on these multiple data (columns).
Goals
The goal of this challenge is to come up with good architecture and algorithm to programmatically label huge time-series data using smaller training data.
Your idea (and program) also needs to be versatile to various types of time-series data. “Various types” means that your program needs to be able to label data from sensors attached to the human body (like heart sounds) and sensors attached to manufacturing equipment (like vibration warnings) equally.
-- Sample Data
We will provide 2 types of time-series sensor data, and training data that has human provided labels to the portions of them. The files will be provided in the forums.
- Time-series sensor data in CSV format, having following columns:
- Time
- Sensor Data 1...N
- As obvious, the number of sensors (columns) varies per data type.
- Training data in CSV format, having following columns:
- Start Time
- End Time
- Label
- Labels can be specified as just characters. In the case of sample data No. 1, it’s 0~8. Please note that the labels can be less or more (ex. just 3 for manufacturing equipment emulating “ inactive(1) / abnormal(2) / idling(3) “)
-- Idea and Algorithm that you need to come up
Training data is labeling just portions of the actual time-series data. The objective is to label time-series data (rows) that are NOT yet labeled from the given training data.
The program should output new CSV file (predicted.csv) with the time (rows) filled with labels.
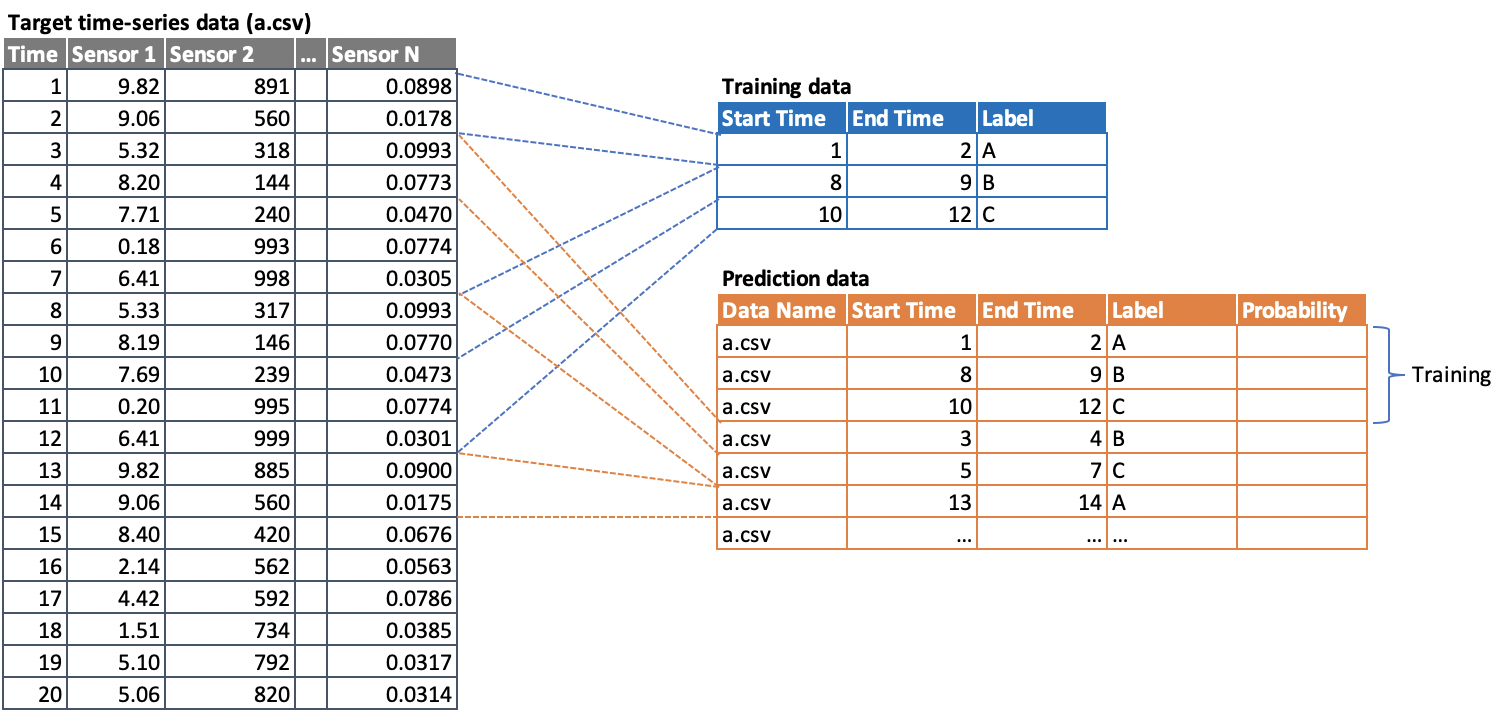
Below is the overall diagram of what we will be looking for;
Note:
- Labels on training data are scattered around. For example, if target time-series data have time from 1 to 100, the training might be labeling only from 10 to 40 and 60 to 70. This means that you will need to come up to label 0 to 10, 40 to 60, and 70 to 100 areas.
- You should also note that in normal case, there could be rows that labels are not applied since those rows do NOT implicate any feature patterns that training data has labels on.
-- The Report
We are looking for a report that clearly and logically understand why your idea is a great one, and how it is implemented to the actual running program.
Following are the key technical items that we would like to know how your idea is labelling time-series data and why it is a great solution.
- How does your solution/idea cut time-series data into units? Is it fixed or variable length, why did you choose your approach, and why is it better?
- Why can your solution/idea extract valid features accurately from multiple data (columns) correlated in label feature? Please refer to this article as an example if you are not familiar with feature extraction for time-series data.
- Why can your idea (architecture and algorithm) label data accurately?
- Versatility to multiple types of time series data: Without specified change to adapt, can it be applied to other types of time-series data, such as heart sounds, gait data, data from manufacturing equipment, etc.?
Additional rules for the report are written at the Submission section below.
Please note that above is not the only item we are looking in your report. Also, the above items are the one that we currently think are more important to understand the difference and benefits of your idea than others. You are welcome to come up with other items if you see the fit.
-- The Program
Please submit a program that implements your idea.
The program needs to read time-series sensor data and the training data, and output the complete predicted CSV file. At the final evaluation, we will be running your program against different data types that have different numbers of sensors in order to evaluate accuracy, feasibility, and versatility.
The Prediction CSV should have following column format;
- Data name
- You just need to put in the target time-series CSV file name for all the rows
- Start Time
- End time
- Label
- Probability (optional)
- Probability is used just as a hint for the client if your algorithm can output this. And will not be used to score your solution.
Please provide the shell script to run your algorithm as below;
$ predict.sh [target csv] [training csv] [predicted csv]
Where as:
- [input] target csv : file name of the target sensor data
- [input] training csv : file name of the training data
- [output] predicted csv : file name of the csv your algorithm outputs
Additional rules for the program are written at the Submission section below.
Note: Since we are planning follow up contests to enhance the algorithm with real data, your running program doesn’t have to be a perfect solution in this challenge especially in performance and scalability to any type of time-series data as Judging Criteria below addresses.
Example Documentation
The following link in an example report is writing one of the solutions for this challenge. This paper presents a weak supervision framework for programmatically labeling time series training data. However, the description is not specific enough for actual implementation, and we are looking for more detailed documentation that can be applied to actual implementation. We are also looking for actual running code on this challenge.
http://roseyu.com/time-series-workshop/submissions/2019/timeseries-ICML19_paper_44.pdf
Algorithm Candidates
Following are 2 algorithms that might be worth looking at based on the client’s initial research. Note that you are not limited to following ideas but just provided here as an information and hint to get you started.
- Weak supervision
The client predicts that weak supervision could be one of the best applicable architecture as Snorkel and Fonduer are using it.
- Auto-Encoder
The client also considered Auto-Encoder - which can be used to detect anomalies and outliers in datasets after it learns normal data - as a solution before, although the result was not accurate enough in limited testing. Also, some thought is necessary for multiple labeling. Please refer to this article for more details.
Checkpoint Submission
We will be having checkpoint submission in this challenge. We encourage everyone to submit to the checkpoint in order for the possibility of getting feedback from the clients of your idea.
In the checkpoint submission, please at least include the “Overview” part, and let us know what programming language you use.
You do not have to submit for the checkpoint to earn final prizes. But in order to qualify for the checkpoint prizes you must submit to the final round. The timeline and prizes for checkpoint is as follows:
- Checkpoint Deadline: 4 Feb 2020, 19:00 EST
- Checkpoint Prize: $100 for 5 submissions
Final Submission Guidelines
Please package the following 2 items into zip file and submit.
-
Document to describe your architecture/algorithm:
- It should be more than 4 pages in Word or PDF format.
- It should be written in plain English.
- Use of charts, diagrams and tables to explain your ideas is highly encouraged.
- Description of how to run your code needs to be written as a separate section.
- Any reference sources that you’ve used need to be clearly written or stated. Also, description and diagram like UML for used libraries and components in your implementation are highly encouraged.
- Following is the example of chapters;
- Overview
- Abstract of your idea and brief overview of the process
- Overview of why your idea works for variety of time series data
- Idea Points in detail
- Cutting Data
- Preprocessing cut data
- Weighting features
- Detecting features
- Other points that is unique
- Possible issues of your idea
- What can be found as potential issues, and what would be the next step to verify your idea?
- Your experimental code
- Setup detail
- How to run
- Reference
- URL, reports, or books
- Open source libraries, or other libraries used
- etc.
- Overview
-
Program and source files to prove your architecture/algorithm:
- The code should be written in Python, C/C++, Java, JavaScript or R, and run on Linux.
- As mentioned in the Report section, please provide detailed explanation on how to setup and run your program in the report (like the exact python version, and all necessary pip installs) -- We would appreciate if you provide your code and program on the Ubuntu Linux of Docker and submit it.
Note: If you didn't have enough time to complete your code in this contest, you can omit submission of your code and only submit your report, although we will not be able to evaluate accuracy, versatility and scalability in some points as Judging Criteria addresses and then you probably cannot win normal prizes. However, if the client sees your report has potential, they might award you a special prize.
Note: This challenge might be needing extended evaluation period to finalize winners than other normal Code challenges. We will provide details in forums after the final submission deadline.
Judging Criteria
The winners of this challenge will be judged subjectively by the client and Topcoder. Following criteria will be used as basics for the judgement.
-
Feasibility (35%):
- Is your report readable, understandable and logically explained?
- Is your new architecture and algorithm feasible enough to implement? (ex. using OSS in portions of your idea might be seen as a plus as it should be proven solution on that area)
- Can your idea be built within realistic cost?
-
Versatility (35%):
- Are the architecture and algorithm versatile if it was applied to other time-series data? The client prepares other time-series data and runs your code against it to evaluate versatility.
- Can the architecture and algorithm extract features from multiple data (variable columns)?
-
Accuracy (20%):
- How much are the architecture and algorithm accurate in data labeling to each record in time-series data?
- Note that Probability column in prediction csv will not be used for judgement criteria
- This criterion is evaluated with your code. Thus, when you don’t submit your code, accuracy evaluation would be 0 point.
-
Scalability (10%):
- This criterion is evaluated with your report.
- Are the architecture and algorithm scalable if datasets and labeling increase? (Please note that the client is not looking for great performance for this challenge, but is looking to see that your solution can be applied to larger data sets)
Reference
Following are reference URLs to better understand this challenge;
- Example Paper of Week Supervision: http://roseyu.com/time-series-workshop/submissions/2019/timeseries-ICML19_paper_44.pdf
- Snorkel: https://www.snorkel.org/
- Fonduer: https://fonduer.readthedocs.io/en/latest/index.html
- Time-Series Data Feature Extraction: https://towardsdatascience.com/time-series-feature-extraction-for-industrial-big-data-iiot-applications-5243c84aaf0e
- Week Supervision: https://en.wikipedia.org/wiki/Weak_supervision
- Auto-Encoder: https://towardsdatascience.com/auto-encoder-what-is-it-and-what-is-it-used-for-part-1-3e5c6f017726